Feb
10
2021
What happened in the last quarter of 2020? Read our analysis here.
Every quarter, A&N will inform you about the housing market in The Hague with the data from the entire housing market supplemented by our personal experiences in the field.
Below you will find the key figures for the third quarter of 2020 with a link to the full report.
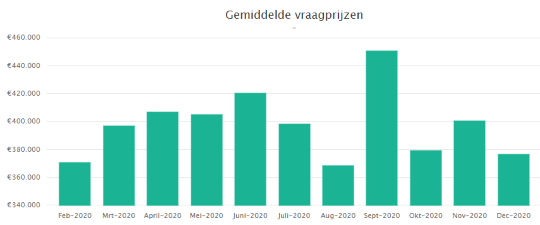
The above graph of average asking prices shows a trend of falling asking prices in The Hague. The fall in average asking prices can be explained by a greater supply in a lower segment. This is consistent with our daily experience. This is partly because it was announced in September that there would be changes in real estate transfer tax from 2021. People who sell a property in a higher segment are thought to have waited until the new year to appeal to a larger target group of private buyers. The private buyers will have a tax advantage from 2021. In addition, the lockdown in December had a slight impact on the willingness to sell in the higher sector. In general, there are fewer transactions in December due to the holidays
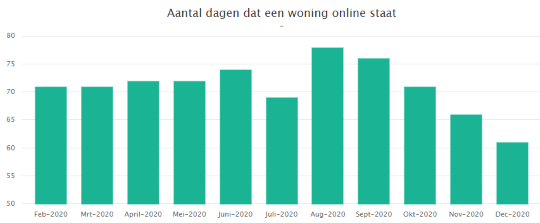
The above graph shows how long homes are listed for sale on average. We are seeing an average decline compared to quarter 3. We noticed that investors wanted to get before 1 January 2021 to buy a property in order to take advantage of a lower tax rate. Because private buyers wanted to wait for completion until after 2020, investors were able to take swift action and homes were sold significantly faster.
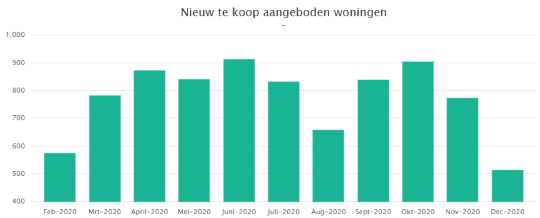
The above graph with the new number of properties listed shows an increase compared to the third quarter. This is mainly seasonal, the holiday period always leads to a decline in new listings. We are seeing that q4 reaches the same level as q2. The exception to this is December, which is the month that shows less movement in the property market each year.
View the full report here including all data for Q4 2020.
December
3
2020
The annual changes to the mortgage rules will take place in 2021. We have listed the most important ones for you in this article.
November
23
2020
What are the effects of Covid-19 on the property market? Read our analysis here.
October
1
2020
The Energy Performance Certificate is changing. The biggest change applies to the energy performance certificate for homes.
